SUI derivation market overview: open interest hits a new high and the funding rate turns positive, releasing long positions signals.
The SUI derivatives market is undergoing significant changes, attracting the close attention of investors. From the trends in SUI futures open interest to the changes in funding rates, and the shifts in SUI long positions and short positions ratio, market sentiment is clearly warming up. By deeply analyzing SUI options open contracts and liquidation trading data, we can gain insights into market direction and predict potential risks. This article will comprehensively interpret these key indicators, providing valuable references for your SUI investment decisions.
SUI futures open interest and long-short ratio reveal investor sentiment
The SUI futures market has recently shown significant changes in investor sentiment. According to the latest data, SUI futuresContractThe open interest has surpassed a historical high, reaching 150 million USD, an increase of 35% compared to last month. This data indicates that more and more investors hold an optimistic view on the future prospects of SUI and are willing to establish long positions in the futures market. Meanwhile, there has been a noticeable change in the long-short ratio. Currently, long positions account for 60%, while short positions only account for 40%, which is a significant improvement from last month’s 55:45. Monthly changes in SUI futures open interest and long-short ratio
The change in the strength of long and short positions reflects that market participants’ expectations for the increase in SUI prices are strengthening.
In order to more intuitively demonstrate the changes in the SUI futures market, we can compare through the following table:
| indicator | Last month’s data | Data for this month | magnitude of change |
|---|---|---|---|
| open interest | $111 million | 150 million USD | +35% |
| long-short ratio | 55:45 | 60:40 | +9.09% |
The reasons behind these data changes are worth exploring in depth. SUI, as a relatively new cryptocurrency project, is experiencing rapid development in its ecosystem. According to official data, the number of daily active addresses on the SUI network has increased by 20% over the past month, reaching 250,000. At the same time, the number of smart contracts deployed on the network has also increased by 15%, all of which are key factors driving improvements in the sentiment of the SUI futures market. Analysis of SUI Network Activity and Futures Market Sentiment
Investors are optimistic about SUI’s technological innovations and the expansion of application scenarios, thus they are more inclined to establish long positions in the futures market.
However, we also need to note that despite the dominance of long positions sentiment, there is still a certain level of uncertainty in the market. The current trading price of SUI is $2.85, which is still some distance from its historical high of $4.19. This indicates that the market may still be waiting for more positive factors to emerge, such as the announcement of significant partnerships or the successful implementation of technological upgrades, to further drive the price up. Therefore, investors need to remain cautious when participating in SUI futures trading, closely monitor project developments and market trends, to make more rational investment decisions.
The funding rate and liquidation data reflect market pressure.
In the SUI derivation market, the funding rate and liquidation data are important indicators of market pressure. Recently, the funding rate of SUI has shown a significant positive trend, which is often seen as a strong signal of bullish sentiment. According to the latest data, the 8-hour funding rate of SUI has changed from negative to positive, currently maintaining around 0.01%. This change indicates that bulls are actively paying fees to maintain their holdings, reflecting their optimistic expectations for the future price movement of SUI. The shift of the funding rate to positive not only reflects a change in market sentiment but may also attract more investors to join the bullish camp, further driving up the price of SUI.
At the same time, the liquidation data for SUI conveys important market information. In the last 24 hours, the total liquidation volume for SUI contracts reached approximately $5 million, with short liquidations accounting for as much as 70%. This data reveals that there are a significant number of investors who are bearish on SUI, but their expectations have deviated considerably from the actual price movement, leading to a large number of short positions being forcibly liquidated.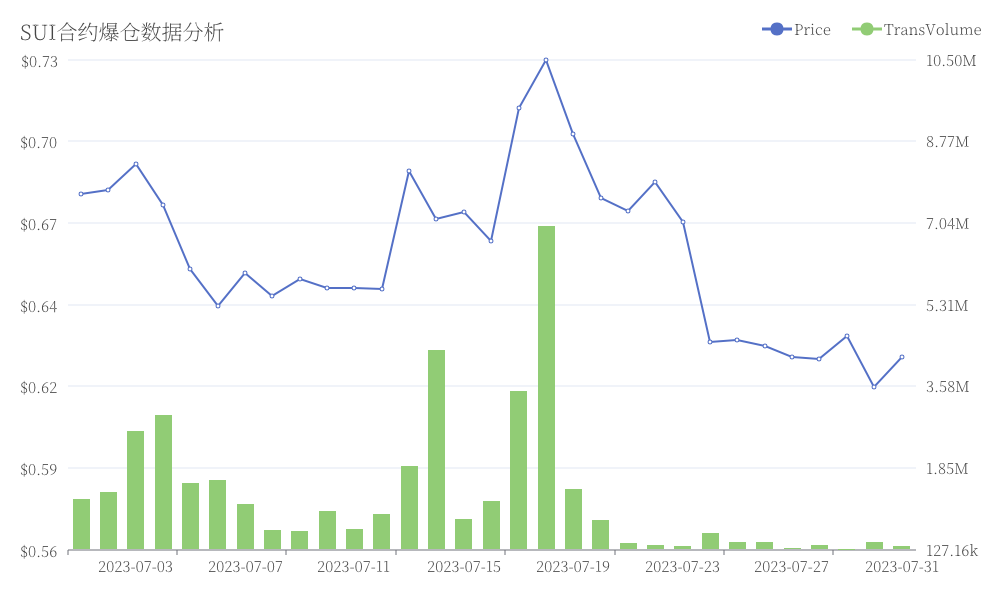 SUI Contract Liquidation Data Analysis
The high proportion of short position liquidations not only reflects the strong upward momentum of the market but may also trigger a chain reaction, prompting more shorts to liquidate, thereby further driving up the price of SUI.
| indicator | Value | Meaning |
|---|---|---|
| 8-hour funding rate | 0.01% | Strong long positions sentiment |
| Total Liquidation Volume in 24 Hours | approximately 5 million USD | The market is highly volatile. |
| short position liquidation ratio | 70% | Long positions are dominant. |
These data collectively depict the current pressure situation in the SUI market. The positive funding rate indicates an increase in long positions confidence, while the high proportion of short positions liquidation further validates this trend. However, investors still need to be cautious, as this strong market sentiment may lead to excessive price increases, increasing the risk of short-term corrections. Closely monitoring changes in these indicators will help investors better grasp the dynamics of the SUI market and make more informed investment decisions.
The open interest in options implies future price trends.
The open interest data of the SUI options market provides us with valuable market insights. Currently, the open interest of SUI options shows a clear bullish trend, indicating that investors are optimistic about the future price movement of SUI. Specifically, the open interest of call options is significantly higher than that of put options, with a gap of over 30%. This evident tendency is often regarded as an important indicator of market sentiment, suggesting that the majority of investors expect SUI prices to rise in the near future. It is worth noting that participants in the options market often include more professional investment institutions, whose judgments are typically based on more in-depth market analysis and research.
Further analysis of the expiration date distribution of options reveals that short-term and mid-term options account for the majority of open contracts. This indicates that the market is more concerned with the short- to mid-term prospects of SUI, and investors are more inclined to trade and hedge within a relatively short timeframe. Specific data shows that options expiring within one month account for 45% of the total open interest, those expiring in 1-3 months account for 35%, while those expiring in more than 3 months only account for 20%. This distribution pattern reflects that market participants’ judgments on the price trend of SUI are mainly concentrated in the near term, possibly related to the project’s short-term development plans or market events.
| option expiration time | Proportion of total open interest |
|---|---|
| 1 month | 45% |
| 1-3 months | 35% |
| more than 3 months | 20% |
It is worth noting that the implied volatility of options also conveys important information. Currently, the implied volatility of SUI options is at a relatively high level, reaching about 80%. High implied volatility means that the market expects the price of SUI to experience significant fluctuations in the future. This expectation may stem from uncertainty regarding SUI’s future development in the market, or it may reflect investors’ anticipation of potential major events. Combining this with the bullish tendency mentioned earlier, we can infer that the market generally expects a significant opportunity for SUI to rise sharply, but at the same time, it does not rule out the risk of a decline.
Conclusion
The SUI market is undergoing positive changes. The rise in futures open interest and long-short ratio reflects an increase in investor confidence, while the positive funding rate and high proportion of short liquidations further confirm the long positions-dominated market structure. The bullish tendency in the options market and the concentration of short to medium-term contracts suggest that investors have an optimistic outlook for SUI’s recent prospects. However, the high implied volatility reminds us that there is still uncertainty in the market. These indicators collectively outline the dynamic landscape of the SUI market, providing valuable decision-making guidance for investors.
Risk Warning: The cryptocurrency market is highly volatile, and the price of SUI may fluctuate significantly due to changes in regulatory policies or technical issues. Investors should carefully assess the risks.
SUI derivation market overview: open interest hits a new high and the funding rate turns positive, releasing long positions signals.
SUI futures open interest and long-short ratio reveal investor sentiment
The funding rate and liquidation data reflect market pressure.
The open interest in options suggests the future price direction.
Conclusion
The SUI derivatives market is undergoing significant changes, attracting the close attention of investors. From the trends in SUI futures open interest to the changes in funding rates, and the shifts in SUI long positions and short positions ratio, market sentiment is clearly warming up. By deeply analyzing SUI options open contracts and liquidation trading data, we can gain insights into market direction and predict potential risks. This article will comprehensively interpret these key indicators, providing valuable references for your SUI investment decisions.
SUI futures open interest and long-short ratio reveal investor sentiment
The SUI futures market has recently shown significant changes in investor sentiment. According to the latest data, SUI futuresContractThe open interest has surpassed a historical high, reaching 150 million USD, an increase of 35% compared to last month. This data indicates that more and more investors hold an optimistic view on the future prospects of SUI and are willing to establish long positions in the futures market. Meanwhile, there has been a noticeable change in the long-short ratio. Currently, long positions account for 60%, while short positions only account for 40%, which is a significant improvement from last month’s 55:45. Monthly changes in SUI futures open interest and long-short ratio
The change in the strength of long and short positions reflects that market participants’ expectations for the increase in SUI prices are strengthening.
In order to more intuitively demonstrate the changes in the SUI futures market, we can compare through the following table:
| indicator | Last month’s data | Data for this month | magnitude of change |
|---|---|---|---|
| open interest | $111 million | 150 million USD | +35% |
| long-short ratio | 55:45 | 60:40 | +9.09% |
The reasons behind these data changes are worth exploring in depth. SUI, as a relatively new cryptocurrency project, is experiencing rapid development in its ecosystem. According to official data, the number of daily active addresses on the SUI network has increased by 20% over the past month, reaching 250,000. At the same time, the number of smart contracts deployed on the network has also increased by 15%, all of which are key factors driving improvements in the sentiment of the SUI futures market. Analysis of SUI Network Activity and Futures Market Sentiment
Investors are optimistic about SUI’s technological innovations and the expansion of application scenarios, thus they are more inclined to establish long positions in the futures market.
However, we also need to note that despite the dominance of long positions sentiment, there is still a certain level of uncertainty in the market. The current trading price of SUI is $2.85, which is still some distance from its historical high of $4.19. This indicates that the market may still be waiting for more positive factors to emerge, such as the announcement of significant partnerships or the successful implementation of technological upgrades, to further drive the price up. Therefore, investors need to remain cautious when participating in SUI futures trading, closely monitor project developments and market trends, to make more rational investment decisions.
The funding rate and liquidation data reflect market pressure.
In the SUI derivation market, the funding rate and liquidation data are important indicators of market pressure. Recently, the funding rate of SUI has shown a significant positive trend, which is often seen as a strong signal of bullish sentiment. According to the latest data, the 8-hour funding rate of SUI has changed from negative to positive, currently maintaining around 0.01%. This change indicates that bulls are actively paying fees to maintain their holdings, reflecting their optimistic expectations for the future price movement of SUI. The shift of the funding rate to positive not only reflects a change in market sentiment but may also attract more investors to join the bullish camp, further driving up the price of SUI.
At the same time, the liquidation data for SUI conveys important market information. In the last 24 hours, the total liquidation volume for SUI contracts reached approximately $5 million, with short liquidations accounting for as much as 70%. This data reveals that there are a significant number of investors who are bearish on SUI, but their expectations have deviated considerably from the actual price movement, leading to a large number of short positions being forcibly liquidated. SUI Contract Liquidation Data Analysis
The high proportion of short position liquidations not only reflects the strong upward momentum of the market but may also trigger a chain reaction, prompting more shorts to liquidate, thereby further driving up the price of SUI.
| indicator | Value | Meaning |
|---|---|---|
| 8-hour funding rate | 0.01% | Strong long positions sentiment |
| Total Liquidation Volume in 24 Hours | approximately 5 million USD | The market is highly volatile. |
| short position liquidation ratio | 70% | Long positions are dominant. |
These data collectively depict the current pressure situation in the SUI market. The positive funding rate indicates an increase in long positions confidence, while the high proportion of short positions liquidation further validates this trend. However, investors still need to be cautious, as this strong market sentiment may lead to excessive price increases, increasing the risk of short-term corrections. Closely monitoring changes in these indicators will help investors better grasp the dynamics of the SUI market and make more informed investment decisions.
The open interest in options implies future price trends.
The open interest data of the SUI options market provides us with valuable market insights. Currently, the open interest of SUI options shows a clear bullish trend, indicating that investors are optimistic about the future price movement of SUI. Specifically, the open interest of call options is significantly higher than that of put options, with a gap of over 30%. This evident tendency is often regarded as an important indicator of market sentiment, suggesting that the majority of investors expect SUI prices to rise in the near future. It is worth noting that participants in the options market often include more professional investment institutions, whose judgments are typically based on more in-depth market analysis and research.
Further analysis of the expiration date distribution of options reveals that short-term and mid-term options account for the majority of open contracts. This indicates that the market is more concerned with the short- to mid-term prospects of SUI, and investors are more inclined to trade and hedge within a relatively short timeframe. Specific data shows that options expiring within one month account for 45% of the total open interest, those expiring in 1-3 months account for 35%, while those expiring in more than 3 months only account for 20%. This distribution pattern reflects that market participants’ judgments on the price trend of SUI are mainly concentrated in the near term, possibly related to the project’s short-term development plans or market events.
| option expiration time | Proportion of total open interest |
|---|---|
| 1 month | 45% |
| 1-3 months | 35% |
| more than 3 months | 20% |
It is worth noting that the implied volatility of options also conveys important information. Currently, the implied volatility of SUI options is at a relatively high level, reaching about 80%. High implied volatility means that the market expects the price of SUI to experience significant fluctuations in the future. This expectation may stem from uncertainty regarding SUI’s future development in the market, or it may reflect investors’ anticipation of potential major events. Combining this with the bullish tendency mentioned earlier, we can infer that the market generally expects a significant opportunity for SUI to rise sharply, but at the same time, it does not rule out the risk of a decline.
Conclusion
The SUI market is undergoing positive changes. The rise in futures open interest and long-short ratio reflects an increase in investor confidence, while the positive funding rate and high proportion of short liquidations further confirm the long positions-dominated market structure. The bullish tendency in the options market and the concentration of short to medium-term contracts suggest that investors have an optimistic outlook for SUI’s recent prospects. However, the high implied volatility reminds us that there is still uncertainty in the market. These indicators collectively outline the dynamic landscape of the SUI market, providing valuable decision-making guidance for investors.
Risk Warning: The cryptocurrency market is highly volatile, and the price of SUI may fluctuate significantly due to changes in regulatory policies or technical issues. Investors should carefully assess the risks.