Gate Research: ETH Hits New Swing High, MYX Surges Over 1600% with Mid-Caps Leading on Volume
Crypto Market Overview
According to CoinGecko, from July 28 to August 11, 2025, the cryptocurrency market maintained a strong upward trajectory, with total market capitalization surging by approximately $412 trillion and most major coins posting double-digit gains. On the technical front, BTC approached a key resistance level, with momentum for adding positions at highs starting to ease and risk gradually building; ETH, by contrast, set a new swing high above 4,300 USDT, although capital inflows still lagged behind BTC.【1】
Recently, the market has been active across multiple fronts, with positive signals emerging from public chains, DeFi, and policy developments. Ethereum’s on-chain transaction volume and transaction count both reached multi-year highs, reflecting a notable rebound in network activity and capital participation. From a macro and regulatory perspective, the U.S. SEC clarified that certain liquid staking products do not constitute securities, clearing compliance hurdles for integrating staking into spot ETH ETFs; President Trump advanced crypto-friendly policies and reinforced Federal Reserve reforms, continuing to send bullish signals; and Hong Kong accelerated RWA compliance efforts, further drawing international capital attention.
Overall, with the public chain ecosystem recovery and policy tailwinds working in tandem, the crypto market has sustained a strong posture and investor confidence has clearly improved. Major assets have remained stable, with BTC maintaining its upward pace in a high-level range—while short-term resistance is near, the bullish structure remains intact; ETH has benefited from on-chain activity and staking tailwinds, keeping its medium-term trend upward. Although short-term momentum has slightly slowed, there is still room for further gains. Trading activity and on-chain capital flows are both showing positive shifts, and combined with stable macro policy expectations and an improving regulatory environment, the market structure is evolving toward a healthier and more sustainable state, laying a solid foundation for subsequent breakouts and broader rallies.
1. Overview of Price Performance
This report groups and analyzes the top 500 tokens by market capitalization to observe their average gains between July 28 and August 11.
Overall, the market structure showed clear divergence, with tokens ranked 301–400 by market cap delivering the strongest performance—an average gain of nearly 30%, significantly outperforming other segments. This indicates that, in the current rally, capital has been more inclined to chase small-to-mid cap assets with higher volatility and growth potential.
Tokens ranked 201–300 and 1–100 followed, posting gains in the 3%–6% range, reflecting stable performance. Meanwhile, tokens ranked 101–200 and 401–500 recorded average increases of 5.04% and 6.29% respectively—modest but still positive.
In summary, capital distribution displayed a “large-cap stability + mid-to-low cap breakout” pattern: large-cap assets maintained steady upward momentum, anchoring the market tone, while mid-to-low cap segments—driven by capital inflows—were more elastic, raising the average gain threshold of this rally. This structure suggests a rebound in risk appetite, with the market shifting from a purely large-cap-led trend toward broader, more diversified allocations, laying the groundwork for sector rotation and sustained momentum.
Note: Market cap distribution is based on CoinGecko data, dividing the top 500 tokens into groups of 100 (e.g., ranks 1–100, 101–200, etc.), then calculating each group’s average price change from July 28 to August 11, 2025, as the average gain for that segment. The overall average gain (9.44%) is the mean of all individual gains for the top 500 tokens, unweighted.
Figure 1: Overall average gain was 9.44%, with the most notable increase seen in tokens ranked 301–400, averaging nearly 30%.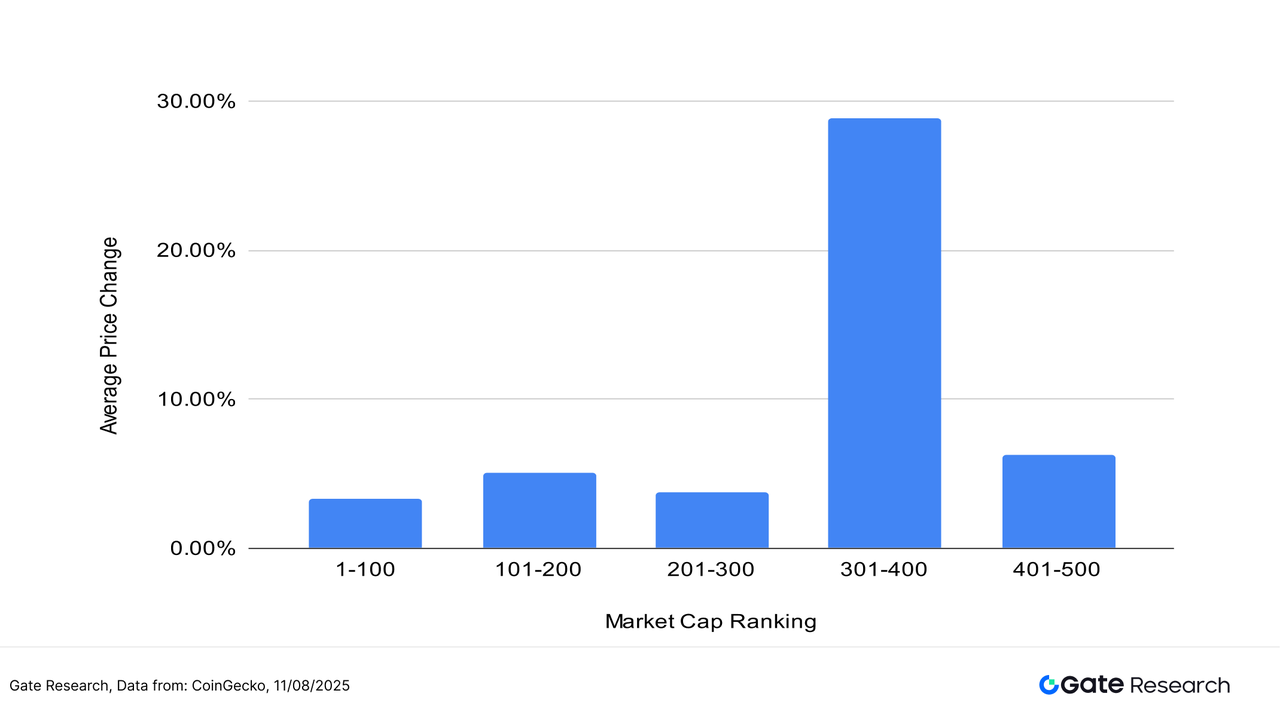
Top Gainers and Losers
Over the past two weeks, the cryptocurrency market has continued its upward trajectory, with capital rotation accelerating and certain small-cap, high-volatility assets delivering standout performances. The top gainers list is dominated by tokens from Meme, public chain ecosystem, and emerging concept sectors—assets with strong narratives and speculative appeal that have become short-term capital favorites.
Leading the gainers, MYX surged an astounding 1608.26%, far outpacing all other tokens. As a multi-chain perpetual contract decentralized exchange, MYX leverages its innovative Matching Pool Mechanism to achieve near-zero-slippage trading and offers leverage of up to 50–125x. Recent listings on multiple exchanges, the announcement of an upcoming V2 upgrade, and expectations for ecosystem expansion—combined with heightened community engagement and capital inflows—have driven a sharp price rally, making MYX the high-beta centerpiece of the market.【2】
TROLL and SOON ranked second and third, with gains of 481.21% and 252.80% respectively, both benefiting from active communities and speculative momentum. XNY, EVA, and TIBBIR posted gains between 90% and 137%, largely supported by specific ecosystem narratives or thematic rotation. MINIDOGE, OMNI, ZORA, and BIO each rose between 65% and 75%, reflecting a strong appetite for mid-to-small-cap assets with high elasticity.
On the losers’ side, declines were relatively mild. KET posted the largest drop of 39.83%, likely due to profit-taking and low liquidity. ACT, SQD, and WEMIX fell between 20% and 23%, mostly projects that had previously seen significant price increases but have since lost momentum, illustrating that even in a broadly bullish structure, assets lacking narrative support or capital inflow undergo periodic corrections.
Overall, this market rebound has been led by tokens with high narrative value, vibrant communities, and potential application scenarios. Capital preference is clearly concentrated on high-beta assets with strong stories, while projects with weak liquidity, fading hype, or unclear narratives are being sidelined. This structural rotation is expected to continue.
Figure 2: The most notable performer was MYX, a multi-chain perpetual DEX project, which surged 1608.26% in two weeks, driven by exchange listings, a V2 upgrade announcement, and ecosystem expansion.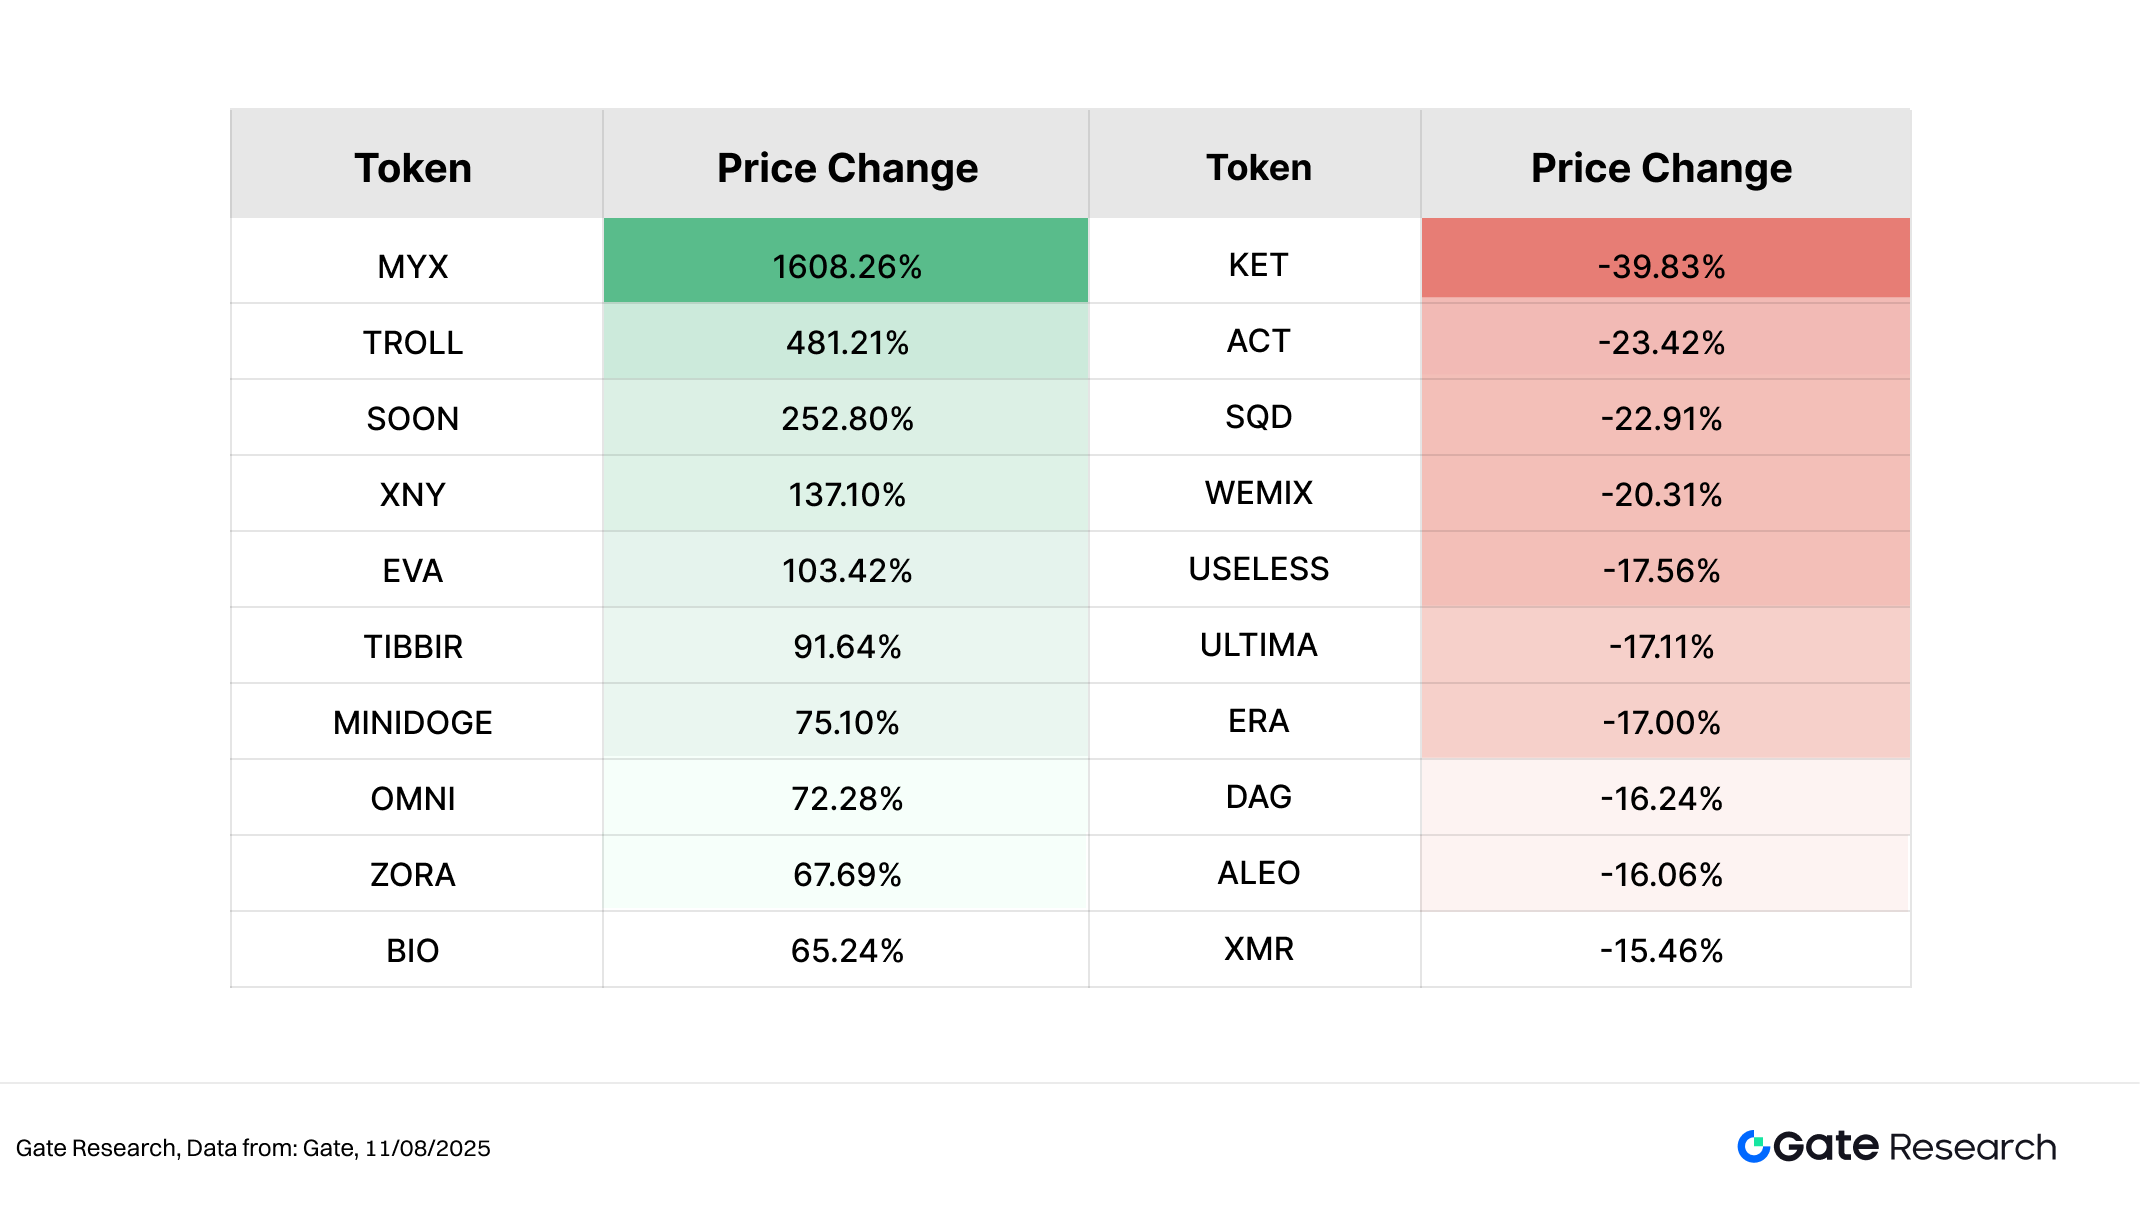
Relationship Between Market Cap Ranking and Price Performance
To further analyze the structural characteristics of token performance in this rally, we plotted a scatter distribution of the top 500 tokens by market cap. The x-axis represents market cap rank (left = larger cap), while the y-axis shows percentage price change from July 28 to August 11, on a logarithmic scale. Each dot represents a token, with green indicating a gain and red indicating a loss.
From the overall distribution, most gains were concentrated in the 5%–100% range, indicating that while market sentiment has improved, it has not yet entered a full-scale rebound. The top gainers were mostly mid-to-small-cap assets, notably MYX, TROLL, SOON, XNY, and EVA, which rose over 100% and appeared in the upper portion of the chart—showing that market capital is gravitating toward high-beta projects with strong narratives, ecosystem backing, or exchange catalysts. MYX’s 1,608.26% surge was the standout, fueled by multiple exchange listings, V2 upgrade anticipation, and ecosystem expansion.
Overall, mid-to-lower-tier market cap segments were relatively active, with clear signs of capital rotation. By contrast, the main decliners—such as KET, ACT, SQD, and WEMIX—tended to be small-to-mid-cap tokens suffering from reduced narrative appeal or weakened liquidity, making them prime targets for capital outflows in a choppy market.
Figure 3: More than half of the top 500 tokens saw gains, with capital favoring mid-to-small-cap projects with clear narratives and high volatility; MYX topped the list.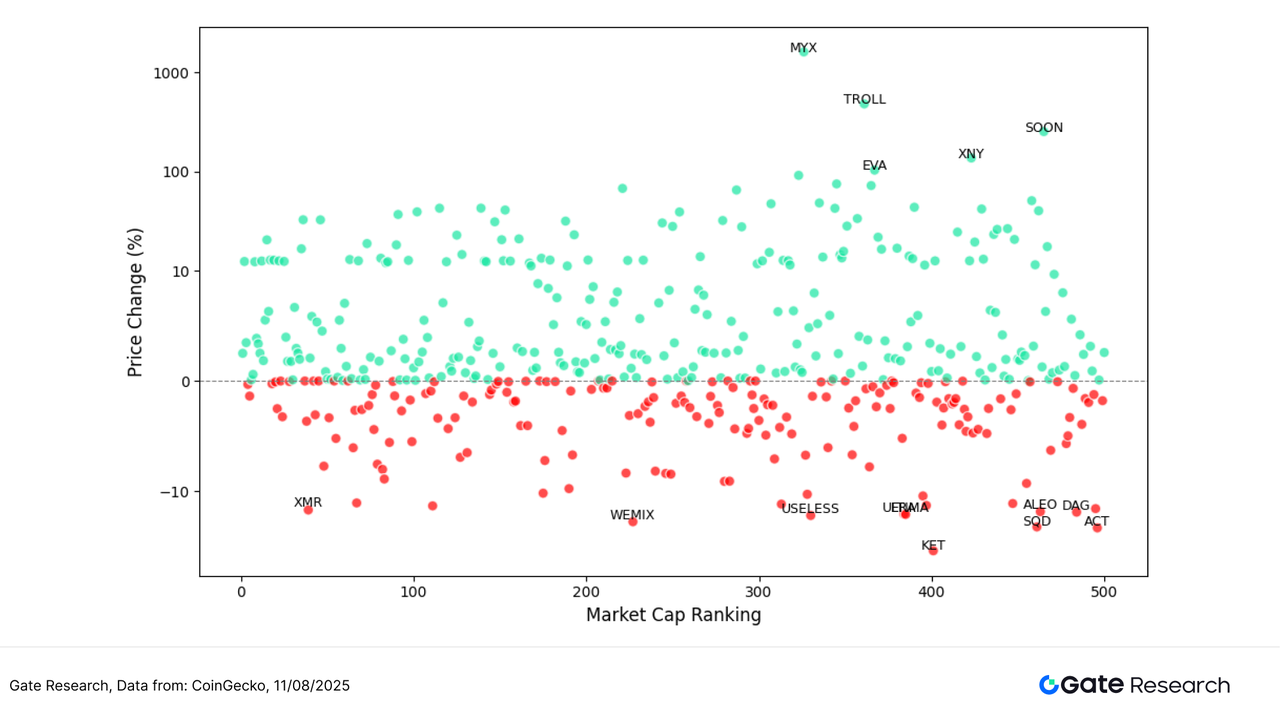
Top 100 Market Cap Leaders
During the current consolidation phase, the top 100 cryptocurrencies by market capitalization have generally shown resilience, with relatively narrow price fluctuations, indicating a defensive capital allocation preference within major sectors. Excluding stablecoins and LSD tokens, the top five gainers were LDO (+36.95%), ENA (+32.68%), MNT (+32.62%), LINK (+20.49%), and IP (+18.82%).
Most of these projects benefited from ecosystem upgrades, cross-chain expansion, or industry event catalysts, reflecting the market’s preference for assets that combine strong narratives with real-world application scenarios. LDO outperformed on renewed optimism in the Ethereum staking sector and expectations for protocol upgrades. ENA and MNT signaled positive developments in stablecoin and public chain ecosystems respectively. LINK’s strategic progress in cross-chain and oracle services continued to earn market recognition, while IP drew capital inflows from heightened community activity and increased market attention.
On the downside, several top 100 projects experienced notable declines. The five largest losers were XMR (-15.46%), BONK (-13.12%), FLR (-8.89%), QNT (-8.02%), and PI (-7.72%). XMR and BONK led the declines, pressured by regulatory headwinds for privacy coins and waning meme token hype, respectively. FLR and QNT saw capital outflows in the absence of significant catalysts, while PI came under pressure from fading expectations and low liquidity.
Overall, top 100 tokens have demonstrated strong resilience in a choppy market, with capital allocation clearly favoring mainstream assets backed by solid narratives, ecosystem catalysts, or long-term growth potential—reflecting a “stable yet selective” investment strategy. Leading gainers often benefited from sector recoveries and ecosystem tailwinds, while previously popular assets lacking fresh narratives faced structural pullbacks. The near-term market is likely to maintain a defensive rotation pattern.
Figure 4: Within the top 100, leading gainers were concentrated in sectors with ecosystem catalysts and narrative advantages, attracting capital into responsive mainstream projects, while some former hot assets corrected.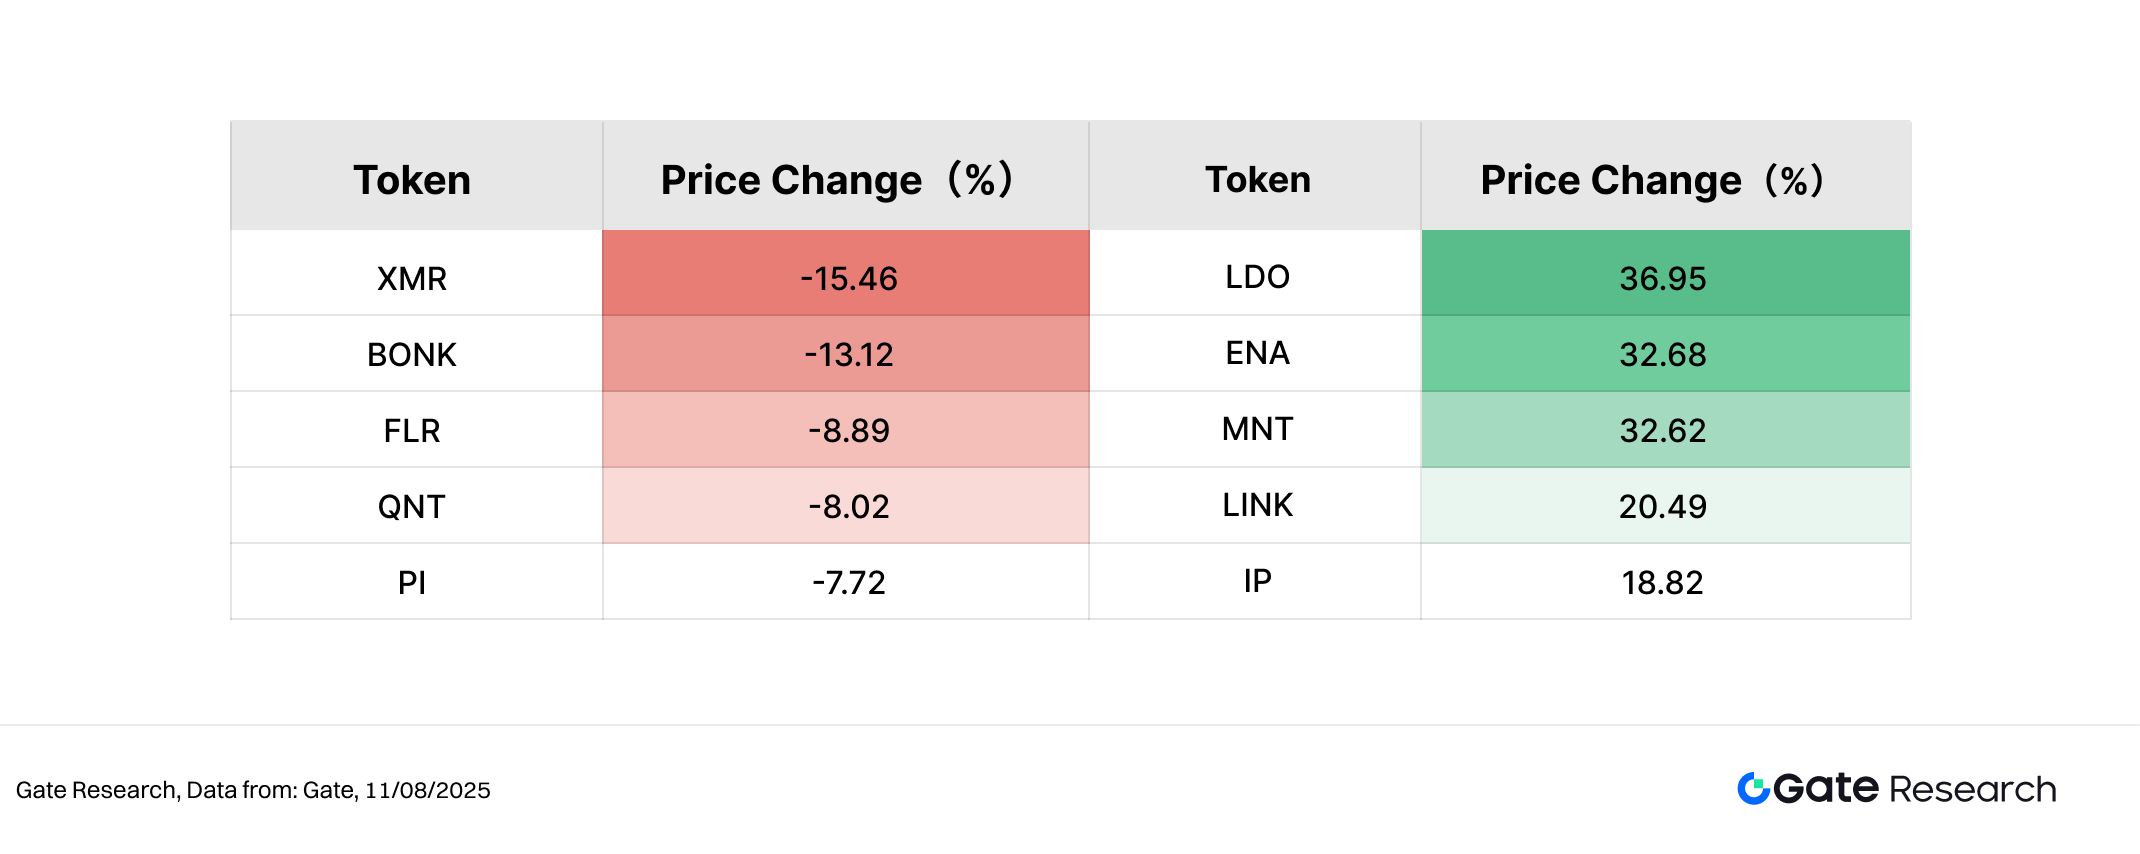
2. Volume Surge Analysis
Trading Volume Growth Analysis
Building on the price performance analysis, this study also examined changes in trading volumes for selected tokens during the current market phase. Using pre-rally trading volumes as a baseline, we measured volume growth multiples through August 11 to assess shifts in market attention and trading activity.
The data shows SOON posted the largest surge in trading volume, up 56.79x, ranking 444th by market cap, highlighting the high elasticity of small-cap assets in speculative capital flows. GMX’s trading volume rose 20.56x, supported by sustained activity in perpetual contracts and the derivatives DEX segment. MYX, the standout performer this cycle, recorded a 13.98x volume increase, driven by exchange listings, a V2 upgrade announcement, and ecosystem expansion, with notable short-term capital inflows and sentiment momentum.
Additionally, COW and AERO saw volume growth of 12.18x and 6.88x, respectively, though their price gains were more modest at 4.83% and 42.75%, indicating that while trading activity has picked up, upward price momentum remains uneven.
Structurally, the current surge in trading volumes spans a wide range of assets—including small-to-mid-cap public chains, derivatives protocols, and exchange-related tokens—rather than concentrating on a single narrative, suggesting that market capital is shifting from concentrated sentiment-driven speculation to a more distributed, multi-theme competition. While a rapid increase in trading volumes does not necessarily guarantee sustained price appreciation, it often signals rising market attention and serves as a key indicator for short-term market trends.
Figure 5: SOON, GMX, and MYX saw significant volume expansions, with some tokens also posting price rebounds, showing that capital is seeking tradable assets with both volatility and liquidity.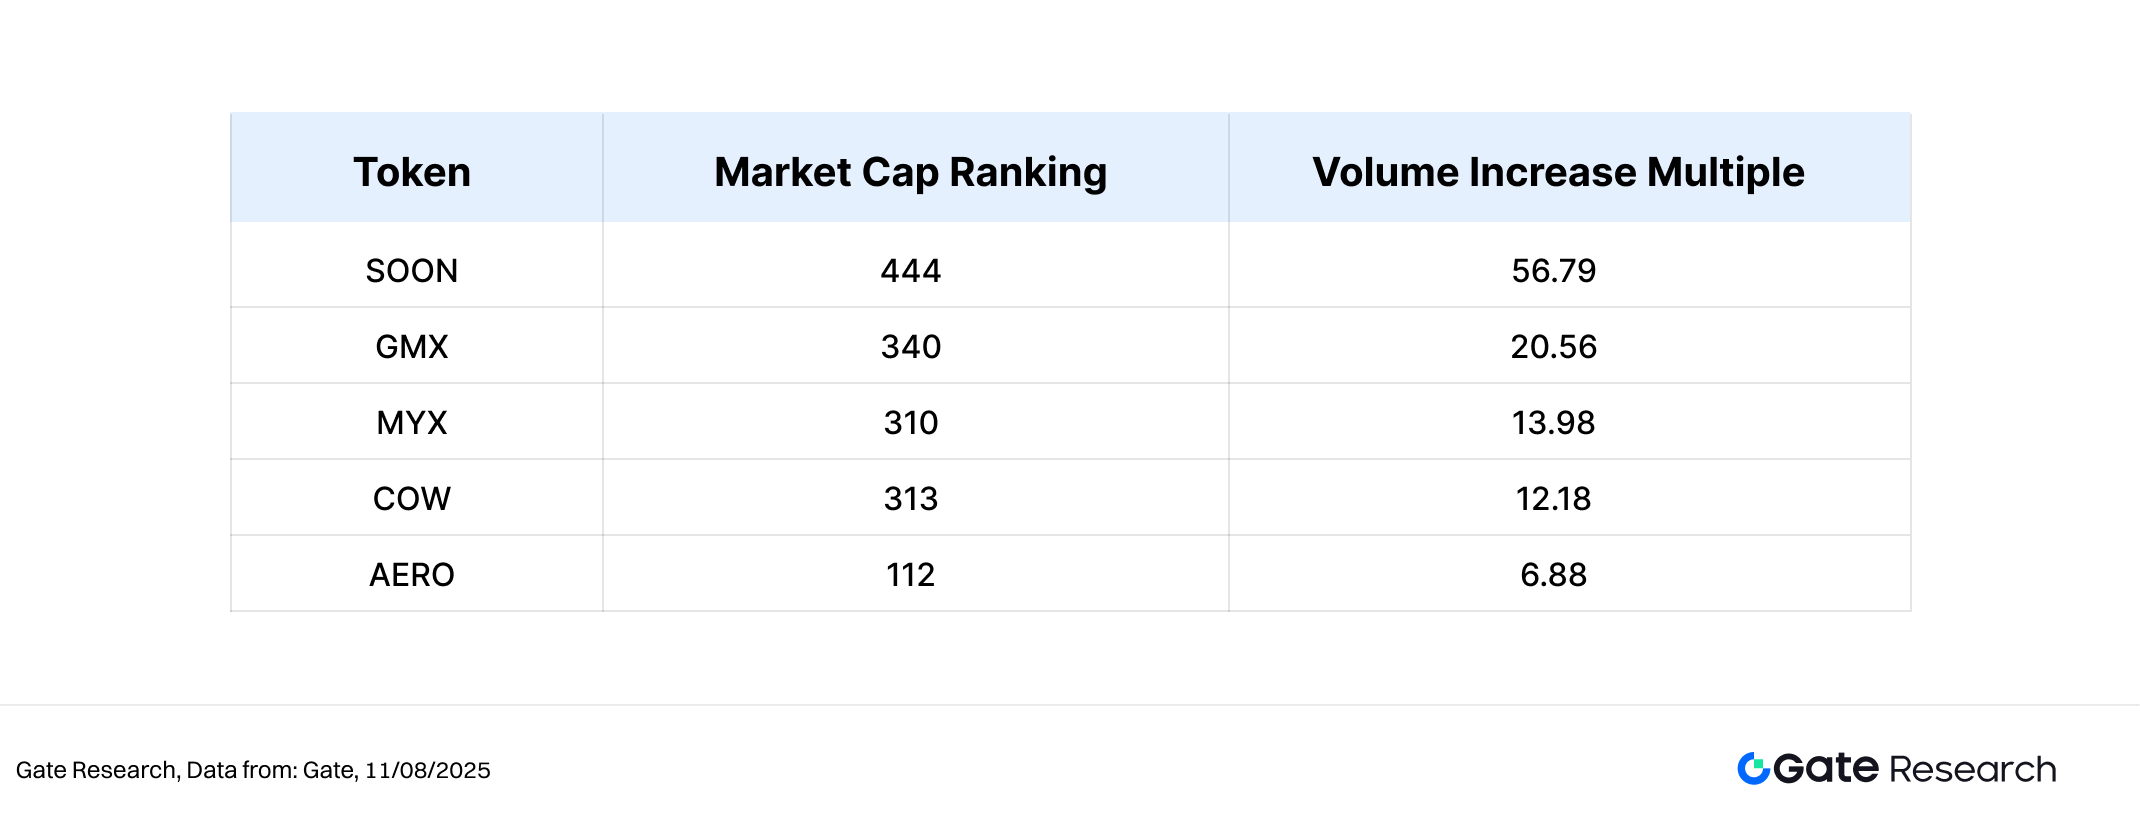
Volume-Price Relationship Analysis
Building on the earlier observations of unusual trading volume patterns, this section further integrates price performance to plot a scatter chart of Volume Increase Multiple (x-axis) against Price Change % (y-axis). The x-axis represents each token’s trading volume growth multiple over the past two weeks relative to the baseline period, and the y-axis shows the corresponding price change. A symmetrical log scale was used to better visualize extreme movements.
From the chart, the upper-right quadrant clusters tokens with both significant volume growth and price appreciation—aligning with the “volume-price resonance” concept. Among them, MYX saw a 13.98x surge in trading volume and a staggering 1608.26% price increase, driven by exchange listings, a V2 upgrade announcement, and ecosystem expansion, attracting strong short-term capital inflows and sentiment-driven momentum. SOON recorded a 56.79x spike in volume and a 252.80% price rise, exemplifying the high elasticity of small-cap projects under sentiment-driven markets. GMX posted a 20.56x increase in volume alongside a 33.61% price gain, maintaining high visibility within the derivatives DEX sector.
Additionally, EVA and AERO also appeared in the upper-right quadrant, with price rebounds of over 30% and 40% respectively, each accompanied by more than a fivefold increase in trading volume—highlighting the dual boost from thematic catalysts and active trading. COW’s trading volume rose by over 12x, but with less than a 5% price gain, suggesting that while trading activity was high, upward momentum was limited.
Overall, tokens in the upper-right quadrant tend to have clear narratives, event catalysts, and sufficient liquidity, making them the focal points of capital flows this cycle. Conversely, some tokens in the lower-right quadrant showed expanded trading volumes but muted price movements, underscoring the market’s more selective approach toward narratives and upside potential in a structurally segmented environment.
Figure 6: MYX, SOON, and GMX occupy the upper-right quadrant, illustrating classic “volume-price resonance” patterns, and are representative of heavily traded, high-performing tokens this cycle.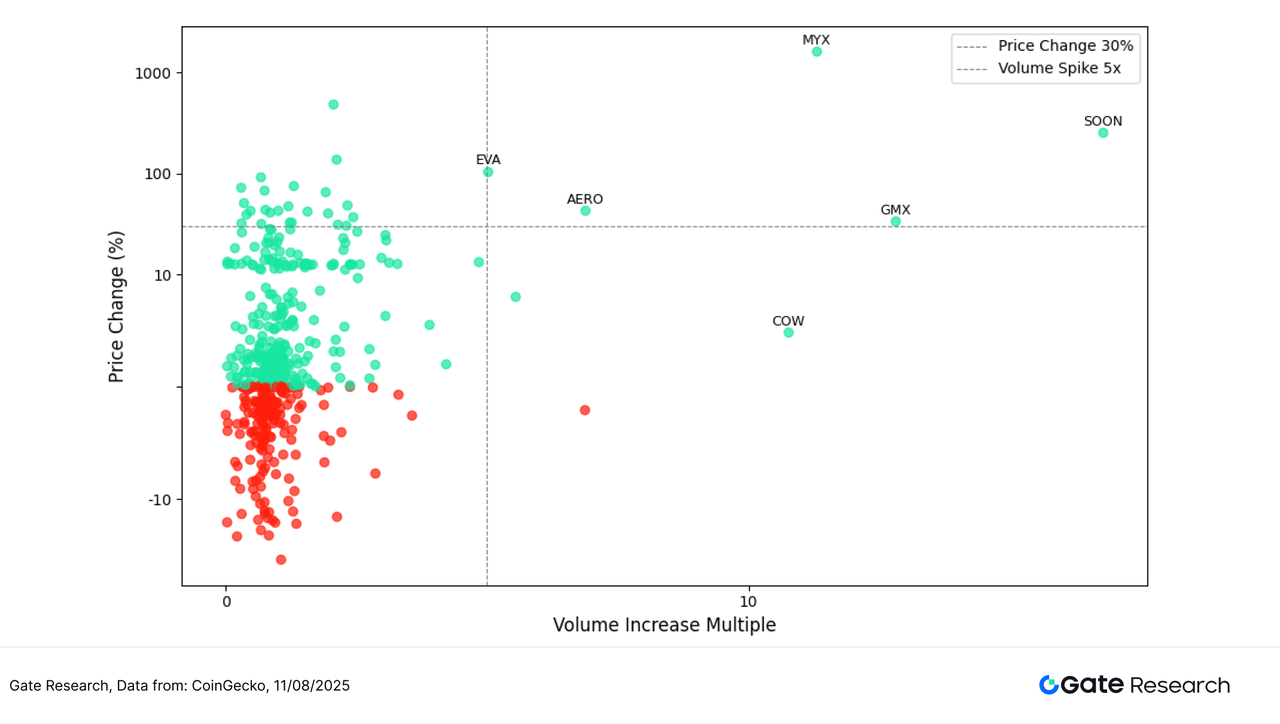
Correlation Analysis
Following the examination of the relationship between trading volume changes and price performance, this section takes a statistical approach to analyzing their structural correlation. To assess whether market liquidity activity systematically influences price volatility, we introduced the Volume-to-Market-Cap ratio as a relative activity metric and calculated its correlation coefficient with price changes. This analysis helps identify tokens more sensitive to capital flows and reveals the strength of volume-price linkages.
The results show that most tokens had correlation coefficients between 0.65 and 0.85, indicating a generally positive relationship between trading activity and price movement. Bubble color in the chart represents correlation strength (red = high, blue = low), while bubble size represents market capitalization, aiding the comparison of volume-price dynamics across asset sizes.
In the upper-left of the chart, small-to-mid-cap tokens such as OMNI, BIO, ORCA, and MYX exhibited the highest correlations (0.82–0.87), meaning their prices tend to move in sync with trading activity—a hallmark of “high-elasticity volume-price linkages” favored by short-term speculative capital.
In contrast, higher-market-cap tokens such as MNT, ZRO, AERO, BTSE, and GAS, positioned toward the right, had slightly lower correlations (around 0.65–0.70) but larger bubble sizes, showing broader capital participation. These assets displayed weaker volume-price sensitivity but more stable price movements, making them more suitable for medium- to long-term holdings or risk-averse investors. Notably, MNT had the largest bubble, signaling substantial capital weight in the current volume-price landscape—remaining a key market focus despite its lower correlation score.
In summary, small-to-mid-cap tokens generally show greater elasticity in volume-price linkages, while large-cap tokens offer ample liquidity but exhibit more tempered price responses. This reflects the structural divergence in market risk appetite and capital allocation preferences.
Figure 7: OMNI, BIO, ORCA, and MYX demonstrate high volume-price linkages and are significantly influenced by capital flows; MNT and AERO show lower correlations but have large market capitalizations, indicating more stable performance.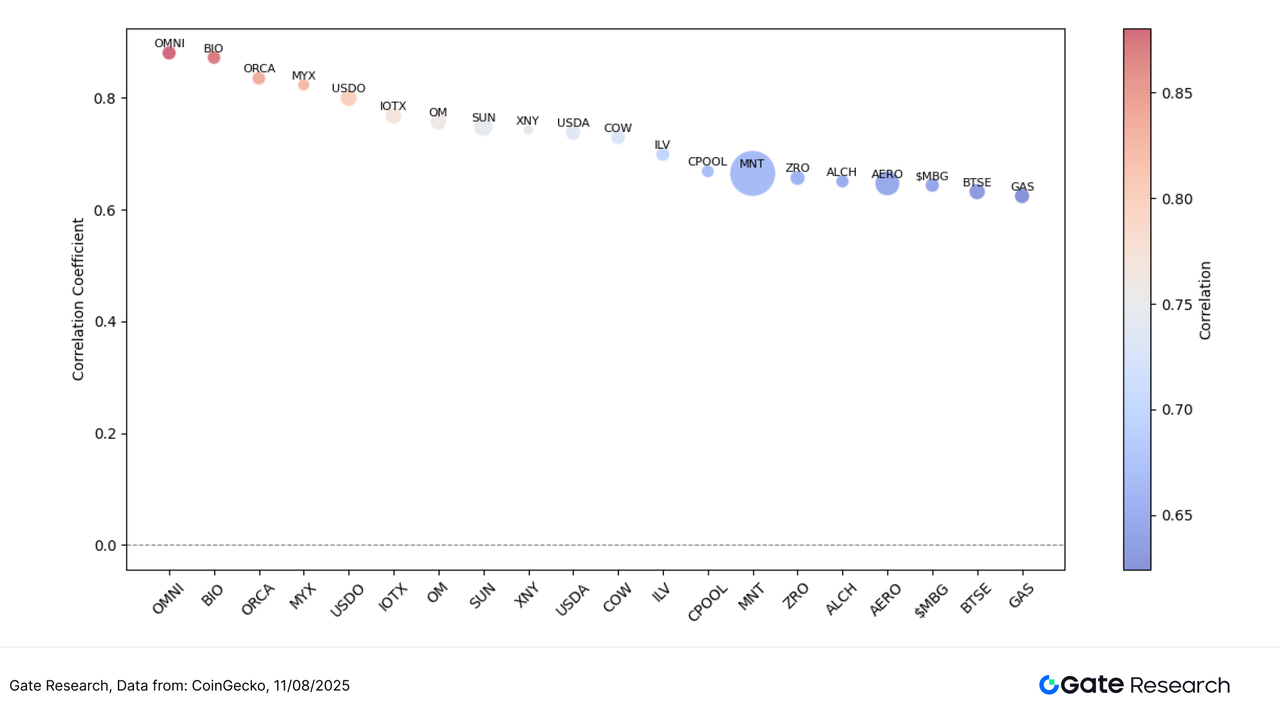
In summary, the current cryptocurrency market has seen a marked increase in volume–price correlation, with trading activity playing an increasingly significant role in driving price volatility. Small- to mid-cap assets such as OMNI, BIO, ORCA, and MYX tend to experience more pronounced price increases when trading volumes surge, showcasing high elasticity and short-term speculative appeal. In contrast, larger-cap assets such as MNT, AERO, and BTSE maintain more stable structures, acting as liquidity anchors in a structurally segmented market. Overall, capital rotation is concentrating on high-activity, strong-narrative tokens, and the pattern of volume–price divergence and structural market conditions is expected to persist.
Beyond active market trading, several potential airdrop projects are also progressing in parallel, covering popular sectors such as points reward platforms, task-based interactive communities, game creation and social platforms, and decentralized node networks. By participating at the right time, users may position themselves to secure future token rewards during periods of market consolidation. The following section outlines the key ongoing airdrop tasks and participation methods.
Airdrop Highlights
This report compiles notable potential airdrop opportunities observed between July 28 and August 11, 2025, including ByteNova (a points reward platform integrating AI and community engagement), Camp Network (a task-incentive interactive platform), Beamable (a creation and social platform for game developers and players), and Nexus (a decentralized node network). These projects generally adopt mechanisms such as social tasks, browser-based node participation, points incentives, or testnet operations to encourage early involvement in ecosystem building. The points and achievements accumulated may later be exchanged for tokens or distributed through airdrops. Users can participate by registering accounts, linking wallets and social profiles, completing tasks, or continuously running nodes to build long-term eligibility. The following sections will detail each project’s positioning, latest activities, and participation pathways to help users capture early-stage Web3 opportunities.
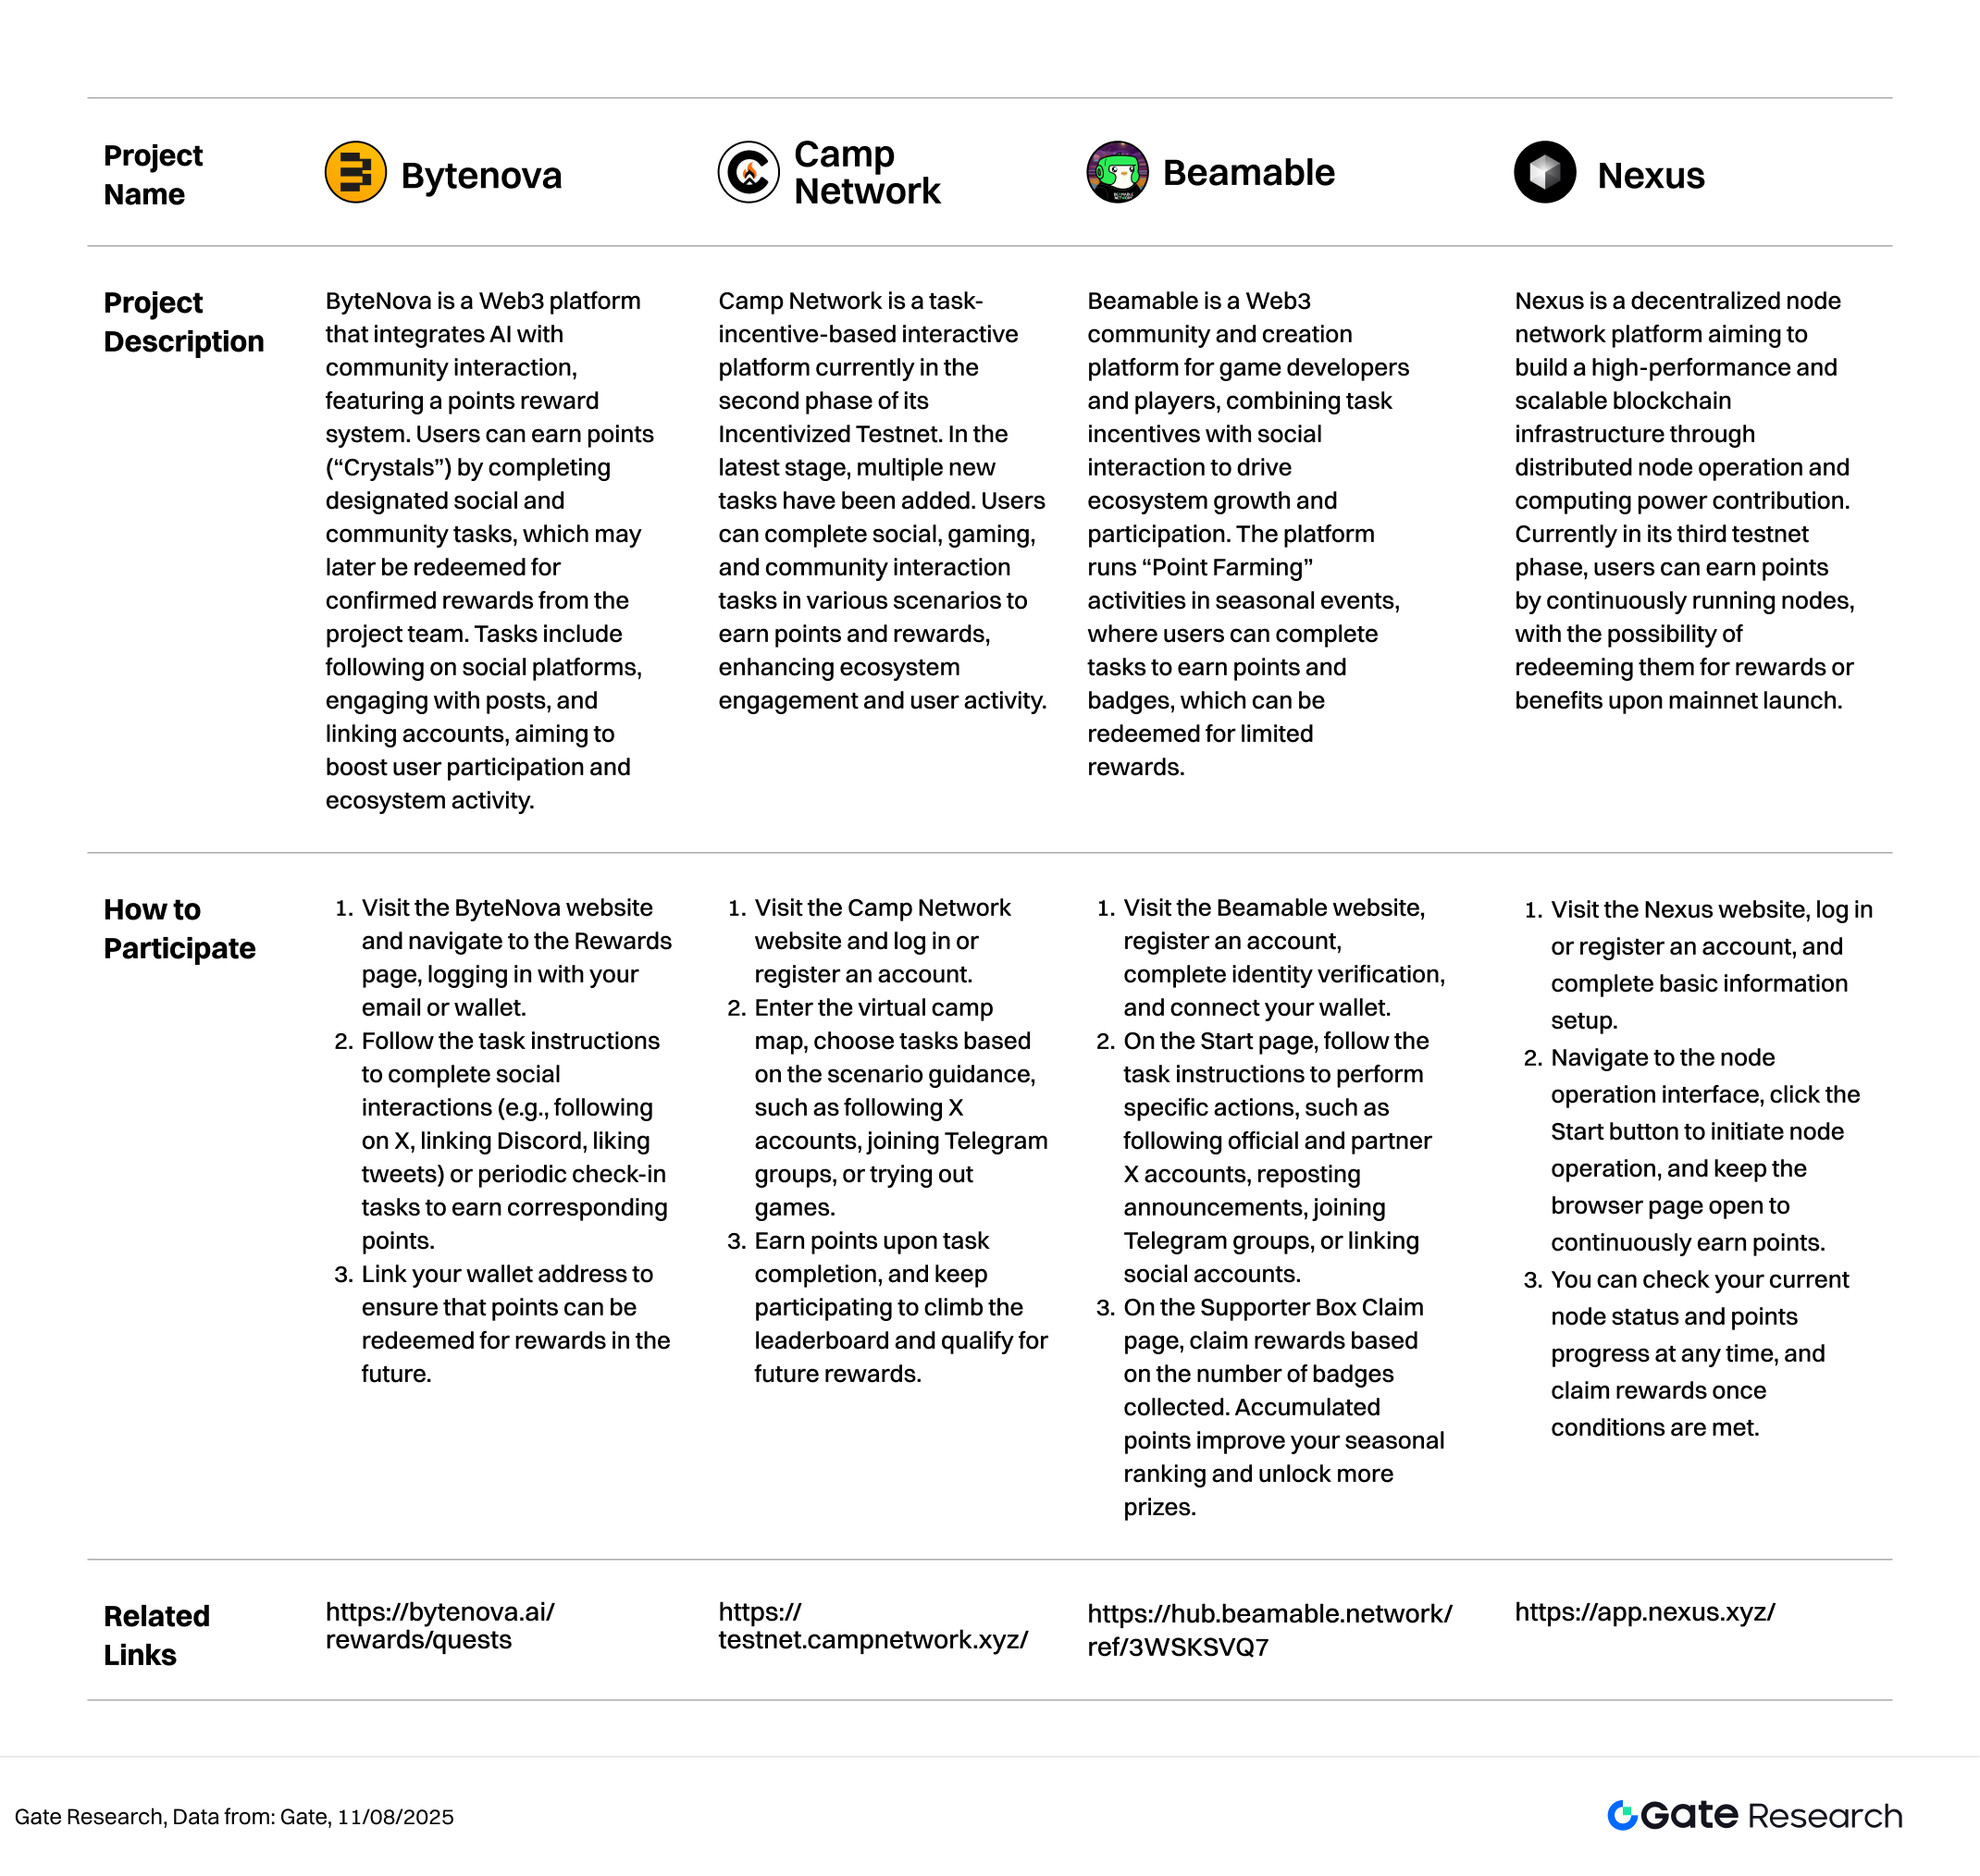
ByteNova
ByteNova is a Web3 platform that integrates AI with community interaction, featuring a points reward system. Users can earn points (“Crystals”) by completing designated social and community tasks, which may later be redeemed for confirmed rewards from the project team. Tasks include following on social platforms, engaging with posts, and linking accounts, aiming to boost user participation and ecosystem activity.【3】
How to Participate:
- Visit the ByteNova website and navigate to the Rewards page, logging in with your email or wallet.
- Follow the task instructions to complete social interactions (e.g., following on X, linking Discord, liking tweets) or periodic check-in tasks to earn corresponding points.
- Link your wallet address to ensure that points can be redeemed for rewards in the future.
Camp Network
Camp Network is a task-incentive-based interactive platform currently in the second phase of its Incentivized Testnet. In the latest stage, multiple new tasks have been added. Users can complete social, gaming, and community interaction tasks in various scenarios to earn points and rewards, enhancing ecosystem engagement and user activity.【4】
How to Participate:
- Visit the Camp Network website and log in or register an account.
- Enter the virtual camp map, choose tasks based on the scenario guidance, such as following X accounts, joining Telegram groups, or trying out games.
- Earn points upon task completion, and keep participating to climb the leaderboard and qualify for future rewards.
Beamable
Beamable is a Web3 community and creation platform for game developers and players, combining task incentives with social interaction to drive ecosystem growth and participation. The platform runs “Point Farming” activities in seasonal events, where users can complete tasks to earn points and badges, which can be redeemed for limited rewards.【5】
How to Participate:
- Visit the Beamable website, register an account, complete identity verification, and connect your wallet.
- On the Start page, follow the task instructions to perform specific actions, such as following official and partner X accounts, reposting announcements, joining Telegram groups, or linking social accounts.
- On the Supporter Box Claim page, claim rewards based on the number of badges collected. Accumulated points improve your seasonal ranking and unlock more prizes.
Nexus
Nexus is a decentralized node network platform aiming to build a high-performance and scalable blockchain infrastructure through distributed node operation and computing power contribution. Currently in its third testnet phase, users can earn points by continuously running nodes, with the possibility of redeeming them for rewards or benefits upon mainnet launch.【6】
How to Participate:
- Visit the Nexus website, log in or register an account, and complete basic information setup.
- Navigate to the node operation interface, click the Start button to initiate node operation, and keep the browser page open to continuously earn points.
- You can check your current node status and points progress at any time, and claim rewards once conditions are met.
Reminder
Airdrop plans and participation methods are subject to change at any time. Therefore, it is recommended that users follow the official channels of the above projects for the latest updates. Additionally, users should exercise caution, be aware of the risks, and conduct thorough research before participating. Gate does not guarantee the distribution of subsequent airdrop rewards.
Conclusion
Reviewing the market cycle from July 28 to August 11, 2025, the cryptocurrency market saw a notable strengthening of volume–price correlations, with trading activity playing an increasingly important role in driving price movements. ETH reached a new swing high, breaking above 4,300 USDT, underscoring its continued trend-following strength among major assets. The overall structure was characterized by both sector rotation and theme-driven moves. Within the top 500 market-cap assets, multi-chain perpetual DEX project MYX posted an exceptional 1608.26% gain; SOON and GMX—both mid-to-small-cap tokens—surged on strong volume, becoming favored targets for short-term capital; large-cap assets such as MNT and AERO showed stable fluctuations, serving as liquidity anchors.
From a trading-volume anomaly perspective, SOON, GMX, and MYX experienced substantial spikes in volume—some exceeding 10×—accompanied by price increases, forming classic “volume–price resonance” patterns that drew significant market attention. The volume–price scatter plot shows that assets in the upper-right quadrant had clearer capital inflows and price reactions, indicating market preference for tokens with liquidity, strong narratives, and event catalysts. Thematic projects such as EVA and AERO also saw simultaneous volume and price gains, driven by ecosystem tailwinds and rising trading activity.
Overall, capital rotation remains focused on “high-activity + strong-narrative” plays, with changes in trading volume still serving as a critical indicator for identifying short-term moves and thematic rotations. Mid-to-small-cap assets displayed greater volatility and trading opportunities in this structural phase, while large-cap tokens provided stability and liquidity support. If policy tailwinds and capital inflows persist, this pattern of structural rotation is expected to continue, laying the groundwork for medium-term momentum.
In addition, this period tracked four potential airdrop projects: ByteNova (AI-integrated community rewards platform), Camp Network (task-incentive social platform), Beamable (game creation and community platform), and Nexus (decentralized node network). These projects span sectors such as rewards systems, interactive communities, game development, and infrastructure. Most are in testing or early incentive stages, offering clear tasks and accessible participation paths. Users can earn points—potentially convertible to tokens or airdrops—by registering accounts, linking social and wallet addresses, completing tasks, or running nodes. Continuous participation not only increases potential token rewards but also enables early positioning for Web3 growth opportunities.
Reference:
- CoinGecko, https://www.coingecko.com/
- X, https://x.com/MYX_Finance/status/1951824008137359767
- ByteNova, https://bytenova.ai/rewards/quests
- Camp Network , https://testnet.campnetwork.xyz/
- Beamable, https://hub.beamable.network/ref/3WSKSVQ7
- Nexus, https://app.nexus.xyz/
Gate Research is a comprehensive blockchain and cryptocurrency research platform that provides deep content for readers, including technical analysis, market insights, industry research, trend forecasting, and macroeconomic policy analysis.
Disclaimer
Investing in cryptocurrency markets involves high risk. Users are advised to conduct their own research and fully understand the nature of the assets and products before making any investment decisions. Gate is not responsible for any losses or damages arising from such decisions.
Related Articles

12 Best Sites to Hunt Crypto Airdrops in 2025

Top 20 Crypto Airdrops in 2025

Gate Research: BTC Breaks $100K Milestone, November Crypto Trading Volume Exceeds $10 Trillion For First Time

Gate Research: 2024 Cryptocurrency Market Review and 2025 Trend Forecast

A Must-Try Project Backed by Binance Labs with Extra Staking Rewards (Step-by-Step Guide Included)
